
Browser-based tools for Data Visualization
Issue #14

I’m Vignesh Kaushik. I curate and write articles on Thank God It’s Computational to help architects, designers, and urban planners leverage cutting-edge technologies on AEC projects.
TGIC is a community-driven platform providing concise technology education to students and professionals in the AEC industry to learn at their own pace. If you’re not a member, consider joining the community and supporting our work.
Data Visualization Using Charts
Plotly: Best Tool for Creating Online Charts
Combining D3.js with stack.gl for an extra shot of 3D goodness, Plotly boasts of all the slickness you’d expect from a commercial product. Plotly’s online platform makes it easy for anyone to turn spreadsheet data into a slick graph. You can perform your analysis using JavaScript, Python, R, Matlab, Jupyter or Excel, and there are several options for importing data. The visualization library and online chart creation tool allows you to make great-looking graphics.

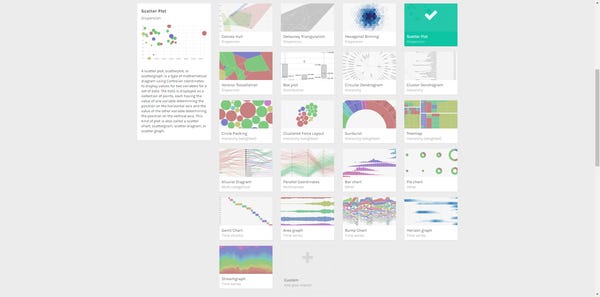
RawGraphs: Create Unique Charts
Raw is built on top of D3.js and is extremely well designed. It has a super intuitive interface and is dead simple to use. It is open-source and therefore doesn’t require you to sign-up to their service. It is one of the few tools that allows you to download your visualization in vector format that is easily editable with Adobe Illustrator, Sketch or Inkscape. It has a library of 16 unique chart types (not come across these chart types in any other online tool) to choose from and all the processing is done in the browser. Your data is not stored anywhere in the cloud, therefore no one can see, touch or copy your data! So your data is safe.
DataHero: Visualize Live Data From Various Sources
Datahero appeals to the novice user. It is in contrast to advanced platforms such as Tableau, which requires a deeper understanding of data analytics. It enables you to pull together data from cloud services and create charts and dashboards. You can simply drag and drop a CSV file into the browser to get started. Once your dataset is ready, it’s just a matter of dragging and dropping values into the canvas area to create a chart. Datahero will then generate the chart it thinks is best suited for your data. Here is a list of all the connectors from where you can import and analyze your data in a single click.

Data Visualization Using Maps
Carto: Create Rich, Dynamic Maps in Seconds
Whether you’re starting from a spreadsheet, connecting your favorite business software, or drawing from vast sensor networks, Carto brings your location data to life. You don’t need to be an expert to start mapping your data. Point and click interfaces lets you do everything from design, to analysis. Dynamic filters allows you to perform visual queries with an intuitive user interface, allowing you to explore and analyse huge amounts of geo-spatial data.

Data Visualization Using Infographics
Quadrigram: Create a Story with Data
If you are looking to create an awesome story around a topic backed by a lot of data, Quadrigram is perhaps the best tool for you. The visualization capabilities of Quadrigram are diverse and highly insightful. You can even connect visualizers and synchronize two charts just by using the output data element of the first chart as the input data element of the second chart. It also has a killer feature in creating Animated Maps that allows user to showcase data using a heat map visualizer and an animator control. Here is a beautiful story about History of Earthquakes where you can see the animated map in action.

Infogram: Create Amazing Infographics
Infogram comes with a simple interface and its charts are well designed. There are over 35 different charts and 200+ maps that makes it easy and flexible to present your data in an interactive web interface. You can edit data directly in the light-weight data editor or connect to a data source in the cloud, or alternatively upload your own spreadsheet too. You can weave your own story by creating an engaging infographic using one among many templates, and personalize them with additional visualization like charts, maps, images and also videos.
