How do APIs for Cities Work?
Issue #32
I’m Vignesh Kaushik. I curate and write articles on Thank God It’s Computational to help architects, designers, and urban planners leverage cutting-edge technologies on AEC projects.
TGIC is a community-driven platform providing concise technology education to students and professionals in the AEC industry to learn at their own pace. If you’re not a member, consider joining the community and supporting our work.
APIs for cities are increasingly becoming essential for smart urban planning because it can give us a real-time understanding of what cities feel like moment to moment rather than a decade to decade. Let’s take a look at a few APIs that help us better understand how cities work and could potentially alter how planners and policymakers engage with urban areas.
Topos Similarity Index • Transforming the way we understand cities with AI
ARTIFICIAL INTELLIGENCE

Pulling data from a wide variety of technologies and disciplines — computer vision, natural language processing, network science, machine learning, statistics, topology, urbanism, data visualization, and information design — Topos are creating a transformative, globally scalable platform for understanding urban life and the culture of neighborhoods. Topos Similarity Index (TSI) takes 50+ heterogeneous data sources and integrates these inputs into a single normalized similarity metric.
TransitFlow • Visualizing transit frequency from the command line
DATA MAPPING

Analyzing transit frequency in an intuitive way can be difficult. Static transit maps provide geographic context but do not give any information about frequency. Timetables provide information about frequency but can be overwhelming, unintuitive, and lacking geographic context. Perhaps we can use spatial-temporal visualization to combine the spatial information of a static transit map with the temporal information of a timetable, and make it easier to think and talk about transit frequency!
Coord • The API layer for the urban transportation market
DATA MAPPING

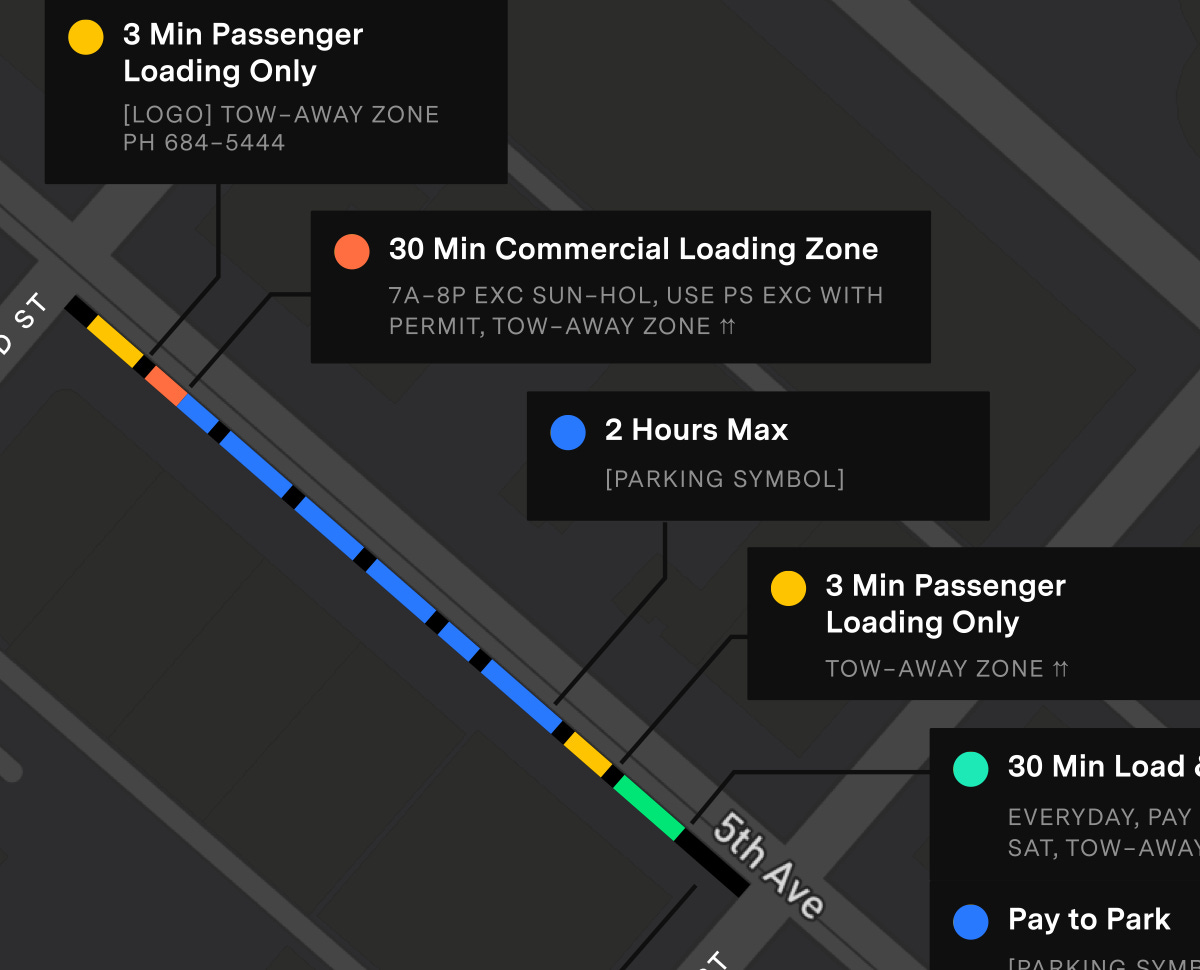
Coord provides developers with APIs to access curb-related data around loading and passenger pick-up zones, street-parking rules, bus stops, and more for New York City, Seattle, San Francisco, and Los Angeles. Integration through the API makes it easy for a navigation app to show users which blocks have ride-hail pick-up zones, for example. Developers can also test out street regulations for Seattle using Curb API.
TopoTopo • Data-Driven 3D Topography Puzzle
DATA MAPPING

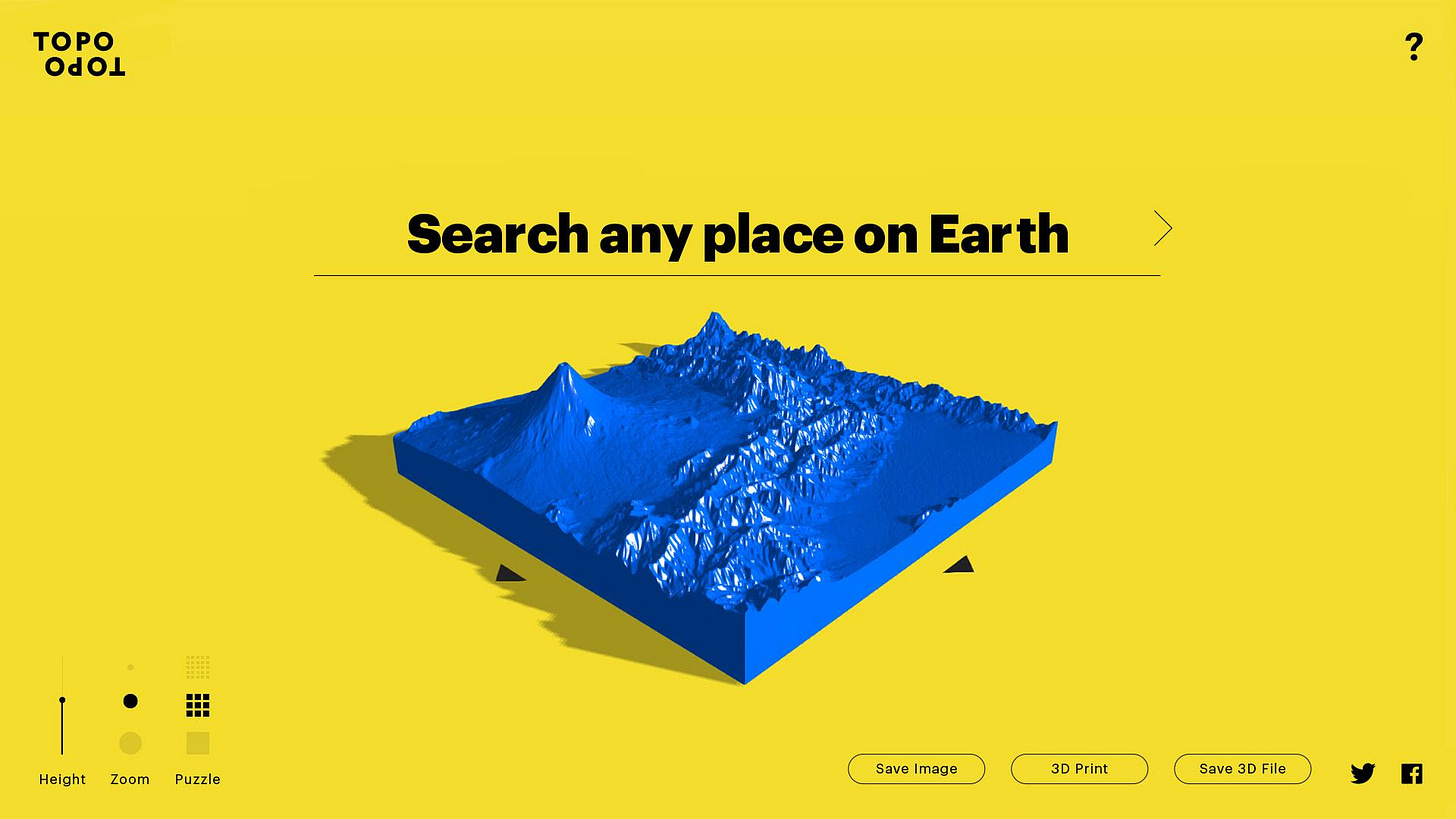
HUSH used the geographic, open-source data from the Shuttle Radar Topography Mission (SRTM), and parsed the data using Google Maps APIs, to make it simple for users to search for virtually any location on our planet. Just type in the name of a location, and the TopoTopo interface makes a 3D visualization that can be customized and explored. Once you’re done playing with the design, select ‘puzzle preferences,’ and you can have your chosen location 3D printed in a number of materials, and shipped right to your door in a customized 5″ topographically-accurate puzzle memento.
MapD • Interactive Analytics at Scale
DATA MAPPING

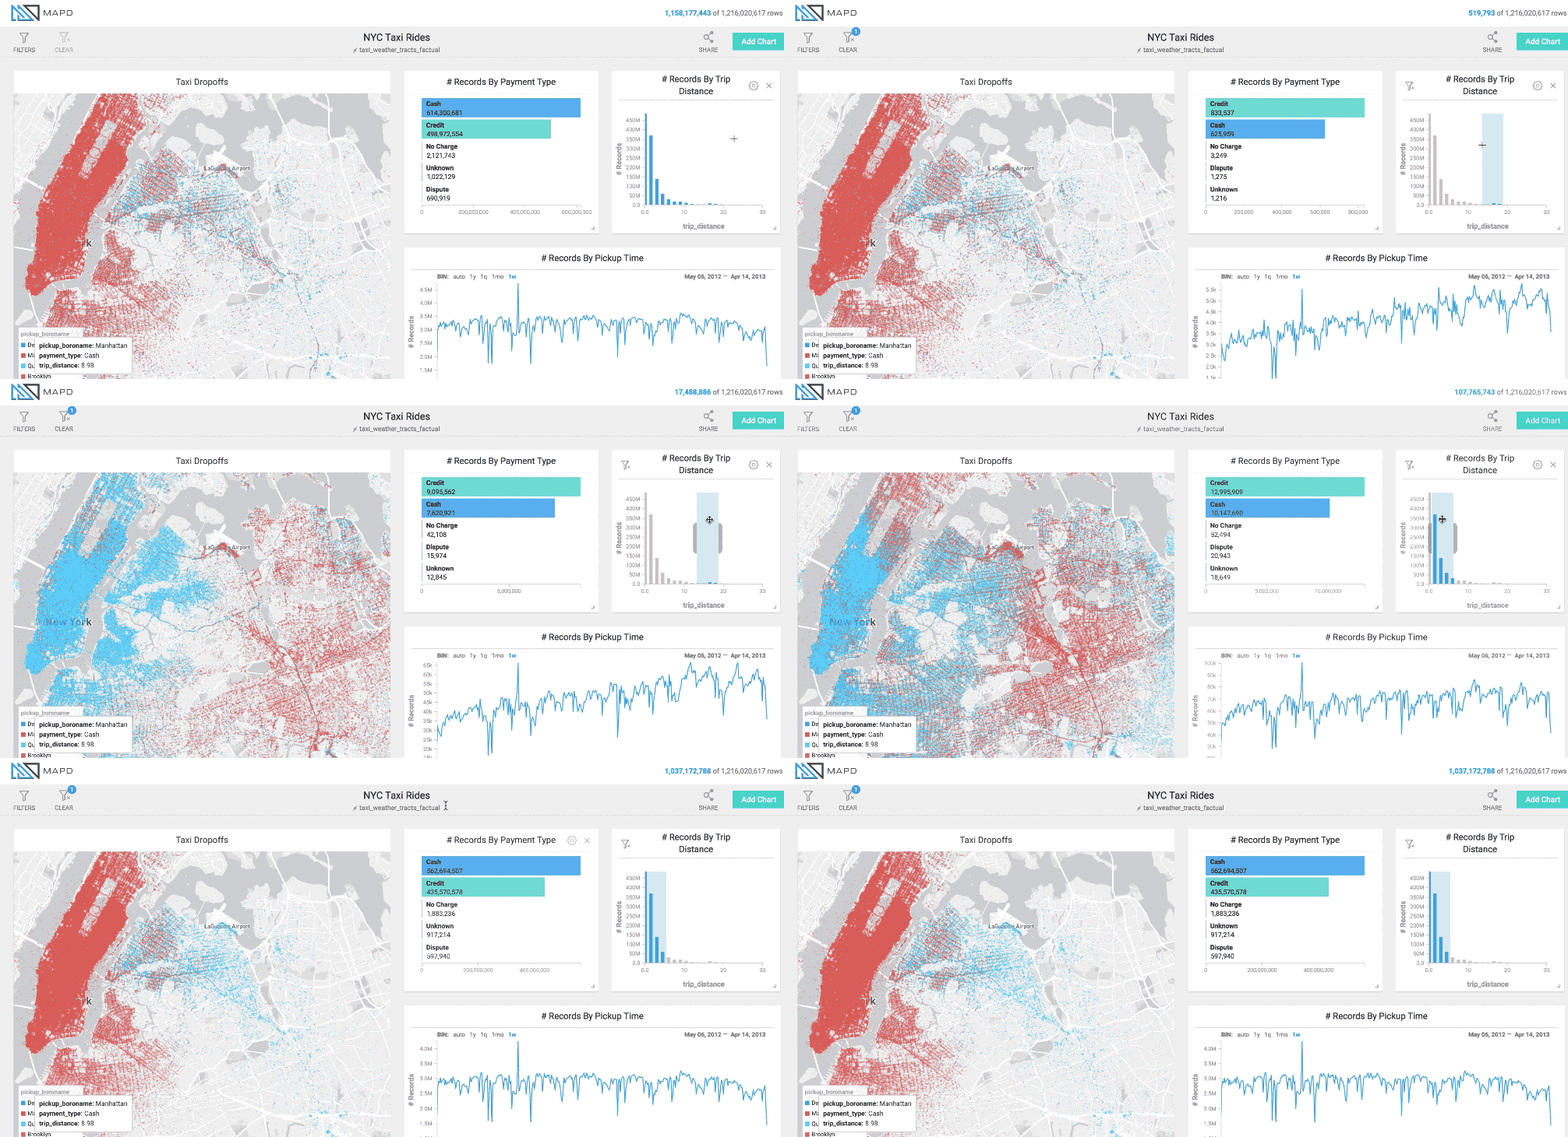
MapD has radically reinvented analytics by enabling you to explore data at the speed of thought. Even as your data grows to a size that makes other tools slow to a crawl, MapD allows you to instantly interact with up to billions of records. The speed and ease-of-use of MapD mean you can start exploring your data and finding hidden insights straight away.

